


为弥补传统方法无法使区域阴极保护达到理想的保护效果的不足。阴极保护数值模拟计算被用于区域阴极保护的优化设计中,如Liu等[8]验证了数值模拟技术能够用于外部腐蚀直接评价 (ECDA)。董亮等[9]分析了区域阴极保护系统与电气系统的兼容性,使用数值模拟软件提高阴极保护效果。崔淦等[10]使用BEASY软件比较了牺牲阳极阴极保护、外加电流阴极保护、牺牲阳极和外加电流联合阴极保护3种保护方式对某一站场的保护效果。尽管数值模拟计算为区域阴极保护方案优化设计提供了一种有效方法,但其精度受限于多种因素[11-13],特别是边界条件的确定,尤其是被保护结构物的阴极极化边界条件对计算结果有较大的影响[14-16]。裸钢的边界条件,可以采用实测的极化曲线作为其边界条件来处理[17,18]。对于涂层钢的边界条件,需要考虑防腐层及极化特性的综合影响[16]。Nisancioglu等[19]认为金属的腐蚀会使其表面结构随时间发生变化,边界条件是随时间发生变化的。Carson等[20]认为生成的腐蚀产物会在表面沉积,边界条件也是随时间在改变。但对涂层钢的极化规律以及阴极极化和防腐层随时间的变化规律认识不足,尚未建立完整的不同类型防腐层结构物在不同环境中的极化特性数据库[21]。因此,对于运行多年的旧站场,不同区域内管道的防护防腐层劣化、破损情况不同,不容易得到带有防腐层管道精确的边界条件[22],这给数值模拟技术在区域阴极保护领域的应用带来了困难[23]。
1 研究方法
研究方法主要包含基于埋地金属结构物的分布信息建立几何模型,裸金属极化特性测试,现场馈电试验,馈电试验反演计算边界条件,利用反演获得的边界条件进行区域阴极保护方案优化计算及实施后的效果验证。
1.1 数学模型
阴极保护数学模型研究的是阴极保护电位和电流密度的分布及其相互关系,假设环境介质为均匀、单一导体,宏观不均匀介质被分割成局部均匀区域来处理,阴极保护体系已经达到稳态,即阴极电流及极化行为已不随时间改变,以便采用静态场理论来处理。稳态阴极保护体系中稳定电流场满足静态场理论,无场源存在时,电位分布方程是Laplace方程 (1):
式中,E为阴极保护电位;x、y、z为3个坐标方向。
要求解上述的Laplace方程,必须给定准确合理的边界条件。在电位场的数值计算中,设所研究的区域阴极保护的范围被表面Γ所包围,则
式中,ΓA为阴极保护系统中阳极地床的外表面,边界条件为恒定的输出电流,电流密度和边界上的法向导数存在以下关系;
式中,I为ΓA边界上的电流密度,可以根据外加电流阴极保护系统的输出电流计算得到边界上的电流密度。
式中,ΓI为绝缘表面,绝缘表面上无电流流入流出,电流密度设为0,其边界条件为:
式中,ΓC为被保护金属结构物的外表面,边界条件常根据极化电位E与极化电流密度I之间的关系确定,
1.2 几何模型建立及数据采集
基于某站场内埋地管道的几何分布,建立了区域阴极保护系统的数值模拟的三维几何模型。
采用Reference 3000型电化学工作站,测量裸碳钢在站场的土壤中的极化曲线。采用三电极体系,工作电极尺寸为10 mm×10 mm×5 mm的20#钢,实验前,先用400#、600#、800#、1000#磨砂纸逐级打磨电极表面,随后依次用去离子水和无水乙醇清洗,吹干后备用。参比电极为饱和甘汞电极 (SCE),辅助电极是混合金属氧化物 (MMO),扫描速率:1 mV/s,扫描范围为在开路电位基础上从-1500 mV扫到1000 mV。
现场试验分为两部分,馈电试验和土壤电阻率测试。馈电试验能为区域阴极保护系统的数值模拟提供管道真实的管地阴极保护电位Ereal的分布。将临时阴极保护电流施加到站场的埋地的金属结构上,采用80 V/50 A临时直流电源和临时阳极地床,将临时阳极地床埋置在所考察站场3个不同的位置,测量地下结构的通、断电电位。通电极化后记录不同位置埋置结构的通、断电位,记录保护电位分布。
土壤电阻率是阴极保护数值模拟中介质的参数,采用ZC-8土壤电阻率测量仪测量站内地面以下2 m范围内的平均土壤电阻率。
1.3 馈电试验反演计算边界条件
在站场内,存在不同时期安装的管道,管道分布密集且防腐层的劣化程度不一样,为了获取被保护金属结构物的边界条件,首先测量了20#钢金属在该裸站土壤中的极化曲线 (式6)
赋予管道防腐层破损率α和防腐层面电阻R初始值 (
其中,α影响的是管道受到阴极保护电流极化难易程度,当阴极保护电流恒定时,α越大,管道不易被极化,管道电位偏正;R影响电位分布均匀性,R越大,管道上的电位分布均匀性越差。将其边界条件带入数学模型中求解,得到结果管道电位E1和馈电试验测试电位Ereal进行比较,若数值模拟得到的电位分布的与真实电位分布误差在10%以内 (
如不满足
1.4 使用反演边界条件进行阴极保护的优化计算及结果验证
不同位置涂层钢的极化特性反演完成后,反演获得的边界条件进行区域阴极保护方案优化计算,获得方案后,进行现场实施,实施后测试效果,将计算结果与测试结果进行比较,验证边界条件反演计算及数值模拟计算的准确性。
2 实验结果与讨论
2.1 几何模型建立及数据采集
在现场调查的基础上,建立了站场的数值模拟三维几何模型,如1a所示。然后对建立的三维几何模型进行数值计算网格化,管道每隔5 m划分一个网格,能够满足网格独立,若继续增加网格数量只会增加计算量,但对精度影响较小,如图1b所示。
图1
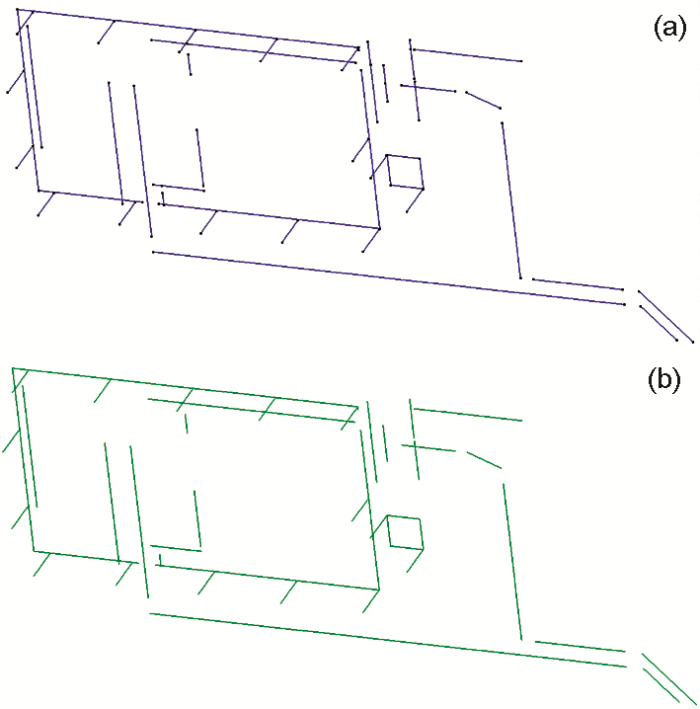
图1
站场埋地管道三维几何模型及网格划分
Fig.1
Three-dimensional models of mesh generation (a) and buried pipelines in station (b)
根据前期站内的资料调研、现场调研和初步馈电试验绘制了站内埋地管道、排污管道、阳极地床位置和管道测试点的分布简图,并确定了临时阳极地床的位置,如图2所示。
图2
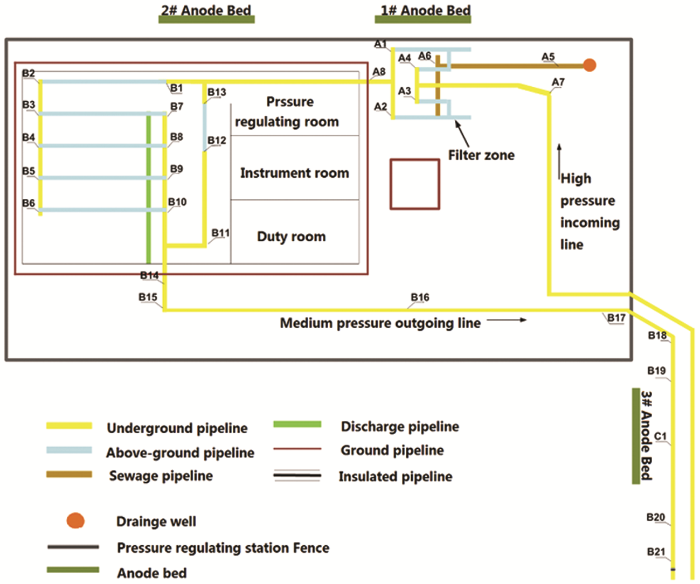
图2
管道分布和临时阳极地床位置图
Fig.2
Gas distribution pipeline networks and position of temporary anode bed
土壤电阻率为22.0 Ω·m,3组临时阳极地床反馈试验极化时间分别为2,1和1 h,输出电压分别为40,32.2和24.2 V,输出电流分别为0.6,2和2 A按照阳极地床编号次序,阳极地床依次独立输出电流,测试不同位置阳极床各点的通电断电电位,并计算断电电位与自腐蚀电位之差,计算出管道电位偏移量ΔV=Voff-Vself,如表1所示。1#阳极地床保护范围大致在A1~A7、B2、B3、B7、B8、B9、B16,断电电位分布为-0.52~0.66 V (CSE) 之间;2#阳极地床站场管道的断电电位分布在-0.66~-0.8 V (CSE) 之间,电位分布均匀。最负点是B6测试点,最正点是B17测试点;3#阳极地床站场 (图中未标注) 断电电位在-0.63~-0.87 V (CSE) 之间,电位分布均匀。最负点是C1,最正点是B2、B8和B21。多组临时阳极地床的馈电数据,为数学模型的计算结果提供了参照。
表1 管道电位偏移和站点反馈数据
Table 1
| Number | 1# Anode bed | 2# Anode bed | 3# Anode bed | ||||||||||
|---|---|---|---|---|---|---|---|---|---|---|---|---|---|
| VselfvsCSE / V | Vonvs CSE / V | Voffvs CSE / V | ΔV / mV | VonvsCSE / V | VoffvsCSE / V | ΔV / mV | VonvsCSE / V | VoffvsCSE / V | ΔV / mV | ||||
| Area 1 | A1 | -0.5 | -1.46 | -0.62 | -120 | -1.74 | -0.74 | -240 | -1.14 | -0.68 | -180 | ||
| A2 | -0.49 | -0.86 | -0.63 | -140 | -1.25 | -0.75 | -260 | -1.03 | -0.7 | -210 | |||
| A3 | -0.47 | -0.97 | -0.62 | -150 | -1.37 | -0.74 | -270 | --- | --- | --- | |||
| A4 | -0.47 | -1.07 | -0.63 | -160 | -1.47 | -0.75 | -280 | --- | --- | --- | |||
| A5 | -0.47 | -1.05 | -0.61 | -140 | -1.44 | -0.73 | -260 | --- | --- | --- | |||
| A6 | -0.5 | -1.1 | -0.63 | -130 | -1.45 | -0.74 | -240 | --- | --- | --- | |||
| A7 | -0.48 | -0.96 | -0.6 | -120 | -1.36 | -0.7 | -220 | --- | --- | --- | |||
| A8 | -0.5 | -1.01 | -0.65 | -150 | -1.47 | -0.75 | -250 | -1.04 | -0.7 | -200 | |||
| Area 2 | B1 | -0.54 | -0.74 | -0.59 | -50 | -1.57 | -0.72 | -180 | -0.82 | -0.65 | -110 | ||
| B2 | -0.44 | -0.64 | -0.56 | -120 | -1.11 | -0.69 | -250 | -0.78 | -0.63 | -190 | |||
| B3 | -0.47 | --- | --- | --- | --- | --- | --- | --- | --- | --- | |||
| B4 | -0.55 | --- | --- | --- | -1.11 | -0.75 | -200 | -0.8 | -0.66 | -110 | |||
| B5 | -0.47 | --- | --- | --- | --- | --- | --- | --- | --- | --- | |||
| B6 | -0.55 | -0.75 | -0.66 | -110 | -1.19 | -0.8 | -250 | -0.88 | -0.71 | -160 | |||
| B7 | -0.49 | --- | --- | --- | --- | --- | --- | --- | --- | --- | |||
| B8 | -0.47 | --- | --- | --- | -1.3 | -0.79 | -320 | -0.82 | -0.63 | -160 | |||
| B9 | -0.54 | --- | --- | --- | --- | --- | --- | --- | --- | --- | |||
| B10 | -0.44 | -0.65 | -0.52 | -80 | -1.17 | -0.67 | -230 | -0.88 | -0.64 | -200 | |||
| B11 | -0.52 | --- | --- | --- | --- | --- | --- | --- | --- | --- | |||
| B12 | -0.52 | -0.7 | -0.57 | -50 | -1.24 | -0.68 | -160 | -0.88 | -0.64 | -120 | |||
| B13 | -0.46 | --- | --- | --- | --- | --- | --- | --- | --- | --- | |||
| B14 | -0.46 | -0.75 | -0.59 | -130 | -1.14 | -0.68 | -220 | -1.11 | -0.69 | -230 | |||
| B15 | -0.48 | --- | --- | --- | --- | --- | --- | --- | --- | --- | |||
| B16 | -0.47 | -0.8 | -0.59 | -120 | -1.2 | -0.7 | -230 | -1.25 | -0.71 | -240 | |||
| B17 | -0.47 | -0.84 | -0.59 | -120 | -1.23 | -0.66 | -190 | -1.57 | -0.7 | -230 | |||
| B18 | -0.49 | --- | --- | --- | --- | --- | --- | -1.64 | -0.72 | -230 | |||
| B19 | -0.48 | -0.75 | -0.57 | -90 | --- | --- | --- | -3.32 | -0.84 | -360 | |||
| B20 | -0.42 | -0.69 | -0.54 | -120 | --- | --- | --- | -1.39 | -0.63 | --- | |||
| B21 | -0.48, (-0.42~-0.52) | --- | --- | --- | --- | --- | --- | -1.29 | --- | --- | |||
| Area 3 | C1 | --- | --- | --- | --- | --- | --- | --- | -3.96 | -0.87 | -870 | ||
2.2 带防腐层管道极化边界条件的反演计算
图3
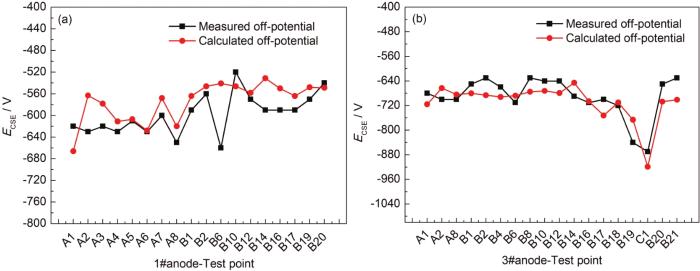
图3
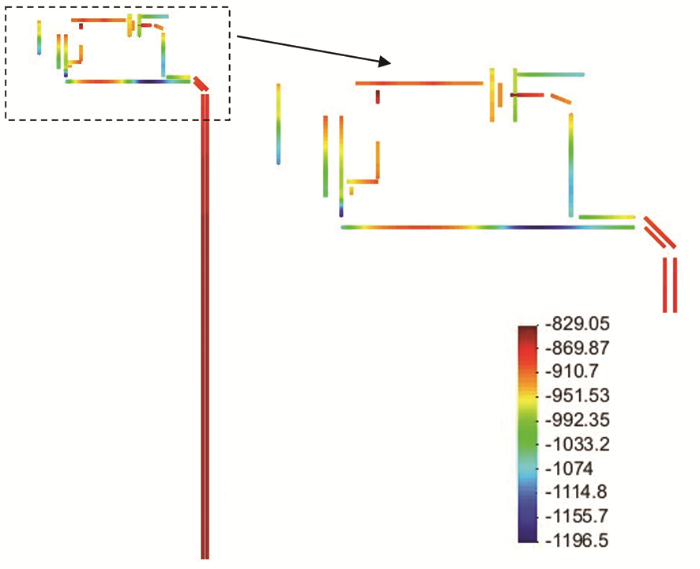
1#和3#阳极床保护实测断电电位与反演结果对比
Fig.3
Comparison of measured off-potential and inversion results of 1# (a) and 3# (b) anode bed
表2 管道防腐层特性反演结果
Table 2
| Test point | Area2 B15~B17 | Area1& Area 2 A7~B17 | Area2 B17~B21 | Area1 A1~A2 | Area1 A8~B1 | Area1 B2~B6 | Other |
|---|---|---|---|---|---|---|---|
| Coating surface resistivity / Ω·m2 | 2000 | 2000 | 2000 | 100000 | 50000 | 100000 | 3000 |
| Coating damage rate | 1.86×10⁻⁴ | 2.48×10⁻⁴ | 3.10×10⁻⁴ | 1.66×10⁻⁶ | 2.48×10⁻⁶ | 8.28×10⁻⁷ | 8.27×10⁻⁵ |
绘制带防腐层的20#钢的极化曲线反演结果,如图4所示,能够明显发现,区域2的B15~B17、区域2的B15~B21以及区域1和2的A7~B17保护准则对应的最小阴极保护电位 (-850 mVCSE) 电流密度较高,在进行阳极地床位置优化时,需要对该区域加密分布阳极地床,施加较多的阴极保护电流。
图4
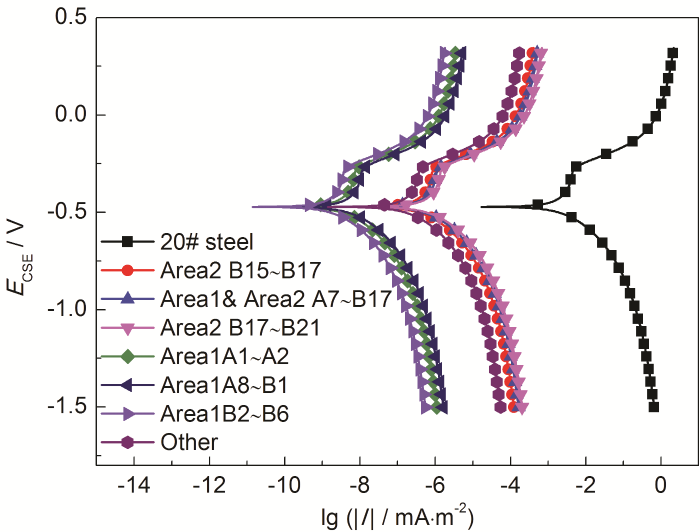
图4
站场埋地管道防腐层极化曲线反演结果
Fig.4
Inversion results of polarization curves for the pipelines coating
2.3 使用反演的边界条件进行阴极保护的优化计算
利用反演计算获得的极化边界条件,进行阳极地床分布优化设计。通过调整阳极的位置、数量,获得了浅埋辅助阳极情况下的分布方案,所考察的站场需要4组浅埋阳极地床,阳极地床位置如图5所示,1~4#阳极地床输出电流分别为4、4、1.8和0.8 A,共10.6 A。
图5
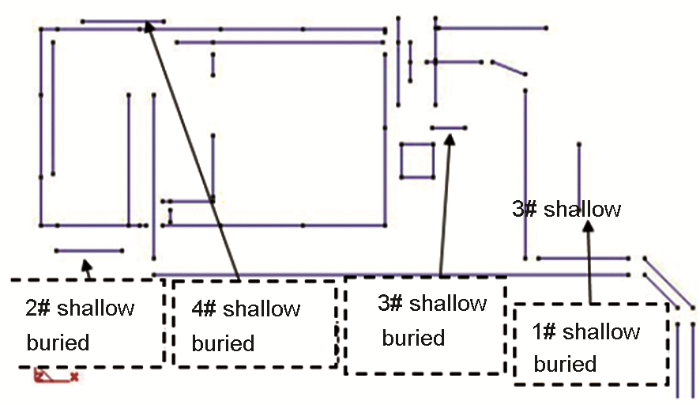
表3 计算电位与实测电位误差
Table 3
| Test point | Measured off-potential V (CSE) | Calculated off-potential V (CSE) | Error |
|---|---|---|---|
| 1# | -1010 | -995 | -1.49% |
| 2# | -1000 | -990 | -1.00% |
| 3# | -1040 | -985 | -5.29% |
| 4# | -1150 | -1160 | 0.87% |
| 5# | -1080 | -1090 | 0.93% |
| 6# | -940 | -920 | -2.13% |
| 7# | -980 | -1030 | 5.10% |
| 8# | -950 | -970 | 2.11% |
| 9# | -960 | -980 | 2.08% |
| 10# | -880 | -965 | 9.66% |
| 11# | -930 | -980 | 5.38% |
| 12# | -970 | -1090 | 12.37% |
| 13# | -970 | -1065 | 9.79% |
| 14# | -940 | -1030 | 9.57% |
| 15# | -880 | -880 | 0.00% |
| 16# | -890 | -880 | -1.12% |
| 17# | -900 | -880 | -2.22% |
| 18# | -960 | -875 | -8.85% |
| 19# | -920 | -875 | -4.89% |
图6
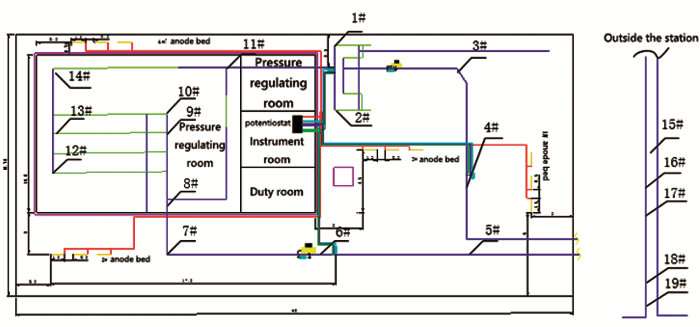
图7
3 结论
(1) 现场馈电试验对获得区域阴极保护所需的电流、保护范围和确定阴极保护系统数值模拟的边界条件具有重要意义。
(2) 在区域阴极保护数值模拟中使用反演计算,可以得到站场中服役多年埋地管道的边界条件,并在现场应用中验证了反演结果的准确性。
(3) 数值计算为确定区域阴极保护阳极地床分布的优化方案提供了一种有效的技术手段。
参考文献
Regional cathodic protection design of a natural gas distribution station
[J].
Application of numerical simulation in regional cathodic protection design of an oil and gas treatment plant
[J].
数值模拟在某油气处理厂区域阴保设计中的运用
[J].
Regional cathodic protection of Dongying crude oil depot
[J].
东营原油库区域性阴极保护
[J].
Problem and countermeasure of the regional cathodic protection facility in natural gas stations
[J].
天然气站场区域阴极保护系统存在的问题及措施
[J].
Key technologies in regional cathodic protection in oil & gas stations
[A].
Cathodic protection design considerations in congested area facilities
[A].
Conflict between copper grounding and CP in oil & gas production facilities
[J].
Numerical simulations for cathodic protection of pipelines
[A].Underground Pipeline Corrosion
[M].
Compatibility analysis of regional CP system and electrical grounding system in Oil & Gas Stations
[A].
Cathodic protection design of station area based on boundary element method
[J].
基于边界元法的站场区域阴极保护设计
[J].
Effect of soil conductivity on the design of cathodic protection systems used in the prevention of pipeline corrosion
[J]. J
Numerical simulation research on cathodic protection parameters of long distance pipeline
[D].
长输管道区域阴极保护参数的数值模拟研究
[D].
Research on regional cathodic protection data management platform of long distance pipeline based on big data
[D].
基于大数据的长输管道区域阴极保护数据管理平台研究
[D].
Study on the boundary conditions of coated steel in numerical simulation of cathodic protection systems
[A].
Research status and existing problems of regional cathodic protection technology in oil and gas transmission stations
[J].
油气输送站场区域阴极保护研究现状及存在问题
[J].
Study on regional cathodic protection for well casings group
[A].
A solution technique for cathodic protection with dynamic boundary conditions by the boundary element method
[J].
Simulation of coating failures on cathodically protected pipelines experimental and numerical results
[J].
Role of surface structure and flow rate on the polarization of cathodically protected steel in seawater
[J].
Time-dependent polarization behaviour of pipeline grade steel in low ionic strength environments
[J].
Study on the cathodic protection scheme in oil and gas transmission station based on numerical simulation
[A].
Problems and solutions concerning cathodic protection in oil and gas transmission station
[J].
油气输送厂站阴极保护相关问题及解决方案
[J].
Applied development of numerical simulation technology in pipeline cathodic protection
[J].
数值仿真技术在长输管道阴极保护中的应用进展
[J].
Thermal boundary condition inversion of strip controlled cooling
[D].
带钢控制冷却热边界条件反演
[D].
Research on heat transfer coefficient inversion method based on the third boundary condition
[D].
基于第三类边界条件的传热系数反演方法研究
[D].
ACA/BEM for solving large-scale cathodic protection problems
[J].
The application of numerical simulation in cathodic protection of pipelines and stations
[J].
数值模拟在管道和站场阴极保护中的应用
[J].
Optimizing the sacrificial anode cathodic protection of the rail canal structure in seawater using the boundary element method
[J].
Factors affecting cathodic-protection interference
[J].
Influence of a simulated deep sea condition on the cathodic protection and electric field of an underwater vehicle
[J].
