


目前,国内外学者对弯管冲刷腐蚀的研究内容主要集中在冲刷腐蚀实验、预测模型及CFD数值模拟等方面。文献[9-11]通过管流式冲刷腐蚀实验,结合阵列电极技术,研究了特定工况下冲刷与腐蚀的交互作用。Zhang等[12]采用90°弯管的多相流模型成功预测了含硫颗粒气体对弯管的冲刷腐蚀行为。Redondo等[13]提出了一种基于不可压缩Navier-Stokes/Cahn-Hilliard方程的冲蚀建模方法,计算得到的管道表面的冲蚀速率分布与实验结果较为吻合。文献[7,14,15]通过CFD数值模拟研究了不同因素对弯管冲刷腐蚀的影响规律,结果表明:冲蚀速率与流速呈正相关关系;随着管径和弯径比的增加,冲蚀速率逐渐减小。
然而,以上关于弯管冲刷腐蚀的研究多采用单因素分析法,且针对单一流向,不能准确得出影响冲刷腐蚀的关键性因素。因此本文选定90°弯管为研究对象,采用正交试验和数值模拟相结合的方法,探究在液固两相流条件下,不同因素对弯管冲刷腐蚀行为的影响程度大小,优选出最佳因素水平组合,并进行了冲刷腐蚀验证实验,基于此可以对冲刷腐蚀导致泄漏的90°弯管进行预测,为实际工程的操作提供理论支持和改进措施。
1 实验方法
1.1 数值模拟
图1

图1
弯管模型及流动方向
Fig.1
Elbow model and flow direction: (a) horizontal to vertical down, (b) vertical up to horizontal, (c) vertical down to horizontal, (d) horizontal to vertical up
冲刷腐蚀模型采用Huser等[17]提出的基于颗粒碰撞角度的通用 (Generic) 模型,将此模型应用到弯管冲蚀速率的计算中:
边界条件:入口条件定义为速度入口 (Velocity-Inlet),湍流强度为5%,出口条件定义为压力出口 (Pressure-Outlet),壁面条件定义为无滑移、标准粗糙度的静止壁面,采用标准壁面函数 (SWF) 处理近壁面区域。入口和出口采用逃逸 (Escape) 类型,壁面采用反弹 (Reflect) 类型,颗粒在壁面上的法向En和切向Et反弹系数见
图2

图2
网格数量与最大冲蚀速率的关系曲线
Fig.2
Relationship curves between the number of grids and the maximum erosion rate
1.2 正交试验设计
表1 因素水平表
Table 1
| Level | A: pipe diameter / mm | B: inlet velocity / m·s-1 | C: flow direction | D: sand diameter / μm | E: sand mass flow / kg·s-1 |
|---|---|---|---|---|---|
| 1 | 30 | 1 | a | 50 | 0.005 |
| 2 | 38 | 2 | b | 100 | 0.01 |
| 3 | 44.5 | 3 | c | 300 | 0.02 |
| 4 | 57 | 5 | d | 500 | 0.03 |
1.3 冲刷腐蚀实验
图3
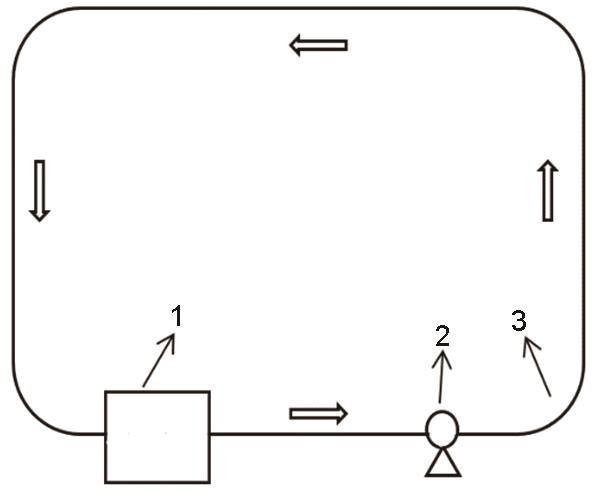
图3
管流式实验装置简图
Fig.3
Tubular experimental device: 1. liquid storage tank (mixing device); 2. self priming screw pump (regulating flow); 3. test bend section
图4

图4
测试弯管段弯管阵列电极排布
Fig.4
Arrangement of array electrodes in the elbow during erosion test
电化学测试使用CHI660E电化学工作站,采用三电极体系,其中圆形阵列电极作为工作电极 (WE),电极面积约为0.2826 cm2,饱和甘汞电极 (SCE) 作为参比电极 (RE),铂片电极作为辅助电极 (CE)。开路电位 (OCP) 测量时间为12 h,电化学阻抗谱 (EIS) 在对应的OCP下测量,施加的电位振幅为5 mV,测量频率范围为105~10-2 Hz,由高频向低频扫描,动电位极化曲线的扫描区间为相对于OCP±300 mV,扫描速率为1 mV/s,实验温度为25~27 ℃。
2 结果与讨论
2.1 数值模拟结果与分析
2.1.1 正交试验数值模拟结果
表2是按照正交试验确定的方案,经数值模拟后得到的以最大冲蚀速率为试验指标的统计结果,为减少误差,最大冲蚀速率采用5次数值模拟的平均值。对统计结果进行分析可以得到不同因素水平对冲刷腐蚀影响程度的大小,从而确定冲刷腐蚀的决定性因素及最优因素水平组合。
表2 基于正交试验的数值模拟结果
Table 2
| Test plan | Factor | Max erosion rate 10-8 kg/m2·s | ||||
|---|---|---|---|---|---|---|
| A:pipe diameter mm | B:inlet velocity m·s-1 | C: flow direction | D: sand diameter μm | E:sand mass flow kg·s-1 | ||
| 1: A1B1C1D1E1 | 30 | 1 | a | 50 | 0.005 | 0.084 |
| 2: A1B2C2D2E2 | 30 | 2 | b | 100 | 0.01 | 1.39 |
| 3: A1B3C3D3E3 | 30 | 3 | c | 300 | 0.02 | 8.6 |
| 4: A1B4C4D4E4 | 30 | 5 | d | 500 | 0.03 | 96.74 |
| 5: A2B1C2D3E4 | 38 | 1 | b | 300 | 0.03 | 0.35 |
| 6: A2B2C1D4E3 | 38 | 2 | a | 500 | 0.02 | 1.85 |
| 7: A2B3C4D1E2 | 38 | 3 | d | 50 | 0.01 | 1.65 |
| 8: A2B4C3D2E1 | 38 | 5 | c | 100 | 0.005 | 3.77 |
| 9: A3B1C3D4E2 | 44.5 | 1 | c | 500 | 0.01 | 0.42 |
| 10: A3B2C4D3E1 | 44.5 | 2 | d | 300 | 0.005 | 0.89 |
| 11: A3B3C1D2E4 | 44.5 | 3 | a | 100 | 0.03 | 3.4 |
| 12: A3B4C2D1E3 | 44.5 | 5 | b | 50 | 0.02 | 7.26 |
| 13: A4B1C4D2E3 | 57 | 1 | d | 100 | 0.02 | 0.13 |
| 14: A4B2C3D1E4 | 57 | 2 | c | 50 | 0.03 | 1.04 |
| 15: A4B3C2D4E1 | 57 | 3 | b | 500 | 0.005 | 0.87 |
| 16: A4B4C1D3E2 | 57 | 5 | a | 300 | 0.01 | 2.48 |
| k1 | 26.7 | 0.25 | 1.95 | 2.51 | 1.4 | --- |
| k2 | 1.91 | 1.29 | 2.47 | 2.17 | 1.49 | --- |
| k3 | 2.99 | 3.63 | 3.46 | 3.08 | 4.46 | --- |
| k4 | 1.13 | 27.56 | 24.85 | 24.97 | 25.38 | --- |
| R | 25.57 | 27.31 | 22.9 | 22.8 | 23.98 | --- |
| Factor order | 2 | 1 | 4 | 5 | 3 | --- |
其中ki 为为任一列上水平数为i (i=1、2、3、4) 时对应的试验指标 (最大冲蚀速率) 之和的算术平均值,同一因素下kmax值与kmin值之差即为该因素极差R。极差R值越大,表示该列因素的数值在试验范围内的变化会导致试验指标在数值上有更大的变化,对试验结果影响最大[24]。
本次试验为单指标正交试验,只需进行单指标分析,即可得出最佳方案。在不考虑因素间的交互作用情况下,由表2中极差R值可知:试验指标为最大冲蚀速率时,因素B (入口流速) 对应的极差R值最大,即为主要因素;随后依次为因素A (管径)、因素E (砂粒质量流量)、因素C (液体流向)、因素D (砂粒直径),因素C和D的极差R相差不大,皆为次要因素,排序影响不大。经综合考虑,五个因素对弯管冲刷腐蚀影响的主次顺序依次为:B>A>E>C>D。
2.1.2 直观分析
为更直观体现不同因素对弯管冲刷腐蚀的影响规律及趋势,以各个因素的四个水平为横坐标,对应的试验指标的ki (i=1、2、3、4) 值为纵坐标,绘制因素指标趋势图,如图5所示。
图5

图5
因素指标趋势图
Fig.5
Factor-indicator trend graphs: (a) pipe diameter, (b) inlet velocity, (c) flow direction, (d) sand diameter, (e) sand mass flow
4号试验冲蚀速率较大的区域均集中在90°弯管的外侧,见图6,位于弯管轴向角度60°到90°之间,径向角度180°附近,弯管外侧靠近出口处的最大冲蚀速率达到9.67×10⁻⁷ kg/m2·s,以船舶海水管路常用的B10铜镍合金为例,换算后腐蚀速率约为3.43 mm/a,B10弯管壁厚一般在1.5~2 mm之间,如果长期在此种工况下运行,弯管在短期服役后就可能会产生泄漏。
图6

图6
冲蚀速率分布云图
Fig.6
Erosion rate distribution cloud maps on x-y plane (a) and y-z plane (b)
2.1.3 优化方案
图7
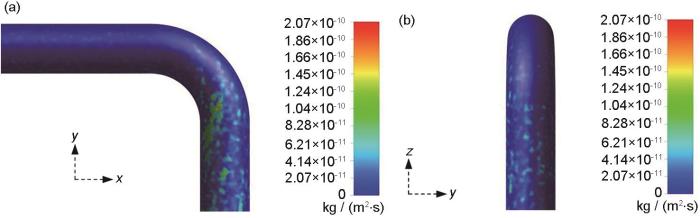
图7
优化试验 (B1A4E1D1C1) 冲蚀速率分布云图
Fig.7
Erosion rate distribution cloud maps on x-y plane (a) and y-z plane (b) in the erosion test under the optimal condition (B1A4E1C1D1)
与4号试验 (B4A1E4C4D4) 相比,最优因素水平下的试验 (B1A4E1C1D1) 的最大冲蚀速率下降幅度明显,降低约3个数量级。冲蚀速率较大的区域由弯管外侧出口处转向内侧,且分布的区域逐渐离散化,未出现局部大面积聚集的现象。
2.2 冲刷腐蚀实验结果与分析
2.2.1 开路电位和极化曲线
图8

图8
1~5号电极开路电位随时间变化曲线经过12 h实验后的极化曲线
Fig.8
OCP vs. time curves of the electrodes 1-5 (a) and their polarization curves after 12 h experiment (b)
表3 实验12 h后1~5号电极开路电位及其极化曲线拟合数据
Table 3
| Electrode | OCP / V | Ecorr / V | ba / mv·dec-1 | bc / mv·dec-1 | Icorr / A·cm-2 |
|---|---|---|---|---|---|
| 1 | -0.272±0.001 | -0.296 | 77.88 | 189.75 | 2.321×10⁻⁵ |
| 2 | -0.273±0.001 | -0.291 | 73.87 | 189.57 | 2.498×10⁻⁵ |
| 3 | -0.274±0.002 | -0.286 | 73.07 | 192.27 | 2.688×10⁻⁵ |
| 4 | -0.278±0.003 | -0.284 | 74.15 | 186.32 | 3.127×10⁻⁵ |
| 5 | -0.280±0.002 | -0.285 | 75.95 | 179.92 | 3.422×10⁻⁵ |
2.2.2 电化学阻抗谱
利用电化学阻抗谱技术,对测试弯管段外侧5个电极进行了研究。图9为测试弯管段5个电极经12 h实验后的电化学阻抗谱测试结果。图9a的Nyquist图显示,5个电极均存在两个半圆弧,分别由高频区的界面处圆弧和低频区的电荷转移圆弧组成。1号、2号电极的电荷转移圆弧明显大于剩余三个电极,而5号电极的电荷转移圆弧的半径最小,说明5号电极的电荷转移电阻最小;图9b的相位角图显示,5个电极均存在两个最大值,相位角最大值的数目代表了弛豫时间常数的个数[2],5个电极均有两个时间常数。利用Zview软件对阻抗谱数据进行等效电路拟合,采用的等效电路如图9所示,其中Rs为溶液电阻,CPE为常相位角元件,Rf为膜层电阻,Rct为电荷转移电阻。
图9
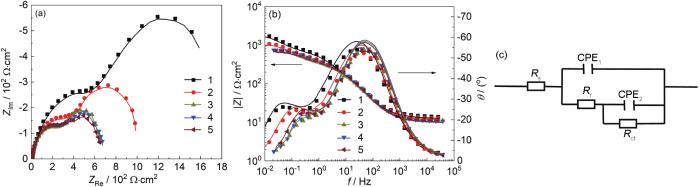
图9
1~5号电极12 h 实验后的电化学阻抗谱及等效电路图
Fig.9
Nyquist (a) and Bode (b) plots of the electrodes 1-5 after 12 h experiment and corresponding equivalent circuit diagram (c)
表4 电化学阻抗谱拟合结果 (电极面积:0.2826 cm2)
Table 4
| Electrode | Rs / Ω·cm2 | Rf / Ω·cm2 | Rct / Ω·cm2 |
|---|---|---|---|
| 1 (0°) | 2.7 | 197.7 | 395.6 |
| 2 (25°) | 2.6 | 124.8 | 175.8 |
| 3 (45°) | 2.8 | 94.5 | 101.5 |
| 4 (65°) | 3.0 | 99.7 | 95.2 |
| 5 (90°) | 3.1 | 98.7 | 89.9 |
其中,Vcorr为腐蚀速率 (mm/a);M为金属的克原子量 (g),n为金属的原子价,F为Faraday常数,Icorr为腐蚀电流密度 (μA/cm2),
2.2.3 腐蚀形貌观察
图10

图10
1~5号电极冲刷腐蚀形貌
Fig.10
Erosion-corrosion morphologies of the electrodes 1 (a), 2 (b), 3 (c), 4 (d) and 5 (e)
3 结论
(1) 不同因素对弯管冲刷腐蚀影响的顺序为:B (入口流速)>A (管径)>E (砂粒质量流量)>C (液体流向)>D (砂粒直径)。
(2) 当因素水平为B4A1E4C4D4,即当B为5 m/s、A为30 mm、E为0.3 kg/s、C为流向水平竖直向上、D为500 μm时,冲蚀速率达到最大,冲蚀速率较大的区域集中在弯管轴向角度60°到90°之间,径向角度180°附近,即位于弯管外侧靠近出口处。
(3) 最优因素水平B1A4E1C1D1试验结果证明:降低流速、增大管径能有效降低冲蚀速率,在管路设计安装时,应避免出现小管径、高流速的情况,在易泄漏的90°弯管处可以采用增大管径、增加壁厚的优化措施。
(4) 数值模拟与实验结果在特定流向弯管的腐蚀速率分布规律上有较好的一致性,但在准确的数值上存在差异,主要是由于冲刷腐蚀模型存在缺陷及实验过程的能量消耗不能完全用数值模拟方法实现等因素造成。
参考文献
A comparative assessment on cavitation erosion behavior of typical copper alloys used for ship propeller
[J].
三种典型船舶螺旋桨用铜合金的空蚀行为对比研究
[J].
Studies on corrosion mechanism, grain boundary engineering and corrosion product film of the marine 90/10 Cu-Ni tubes
[D].
海水管路用B10合金腐蚀机制、晶界工程及腐蚀产物膜研究
[D].
Failure analysis of leaking of seawater tube in a ship
[J].
某船海水管路泄漏失效原因分析
[J].
Material selection and anti-corrosion measures of seawater piping in warship
[J].
舰船海水管系选材及防腐对策
[J].
Review on the effects of hydrodynamic factors on erosion-corrosion
[J].
流体力学因素对冲刷腐蚀的影响机制
[J].
Degradation mechanisms of Co-based alloy and WC metal-matrix composites for drilling tools offshore
[J].
Influence of pipe parameters on flow field of liquid-solid two-phase flow and erosion of pipe bend
[J].
管道参数对液/固两相流弯管流场及冲蚀影响分析
[J].
Electrochemical corrosion behavior of X-65 steel in the simulated oil sand slurry. I: effects of hydrodynamic condition
[J].
Erosion-corrosion of stainless steel at different locations of a 90° elbow
[J].
Erosion-corrosion at different locations of X65 carbon steel elbow
[J].
Experimental and numerical simulation of erosion-corrosion of 90° steel elbow in shale gas pipeline
[J].
Numerical simulation for erosion effects of three-phase flow containing sulfur particles on elbows in high sour gas fields
[J].
CFD-based erosion and corrosion modeling in pipelines using a high-order discontinuous Galerkin multiphase solver
[J].
Analysis on erosion of pipe bends induced by liquid-solid two-phase flow
[J].
固体颗粒对液/固两相流弯管冲蚀作用分析
[J].
Simulation and analysis of liquid-solid two-phase flow erosion failure in pipe bends
[J].
弯管液固两相流冲蚀失效模拟分析
[J].
Erosion corrosion simulation of liquid-solid two-phase flow in 90 degree vertical bend pipes
[J].
90°竖直弯管的液固两相流冲刷腐蚀模拟
[J].
Prediction of sand erosion in process and pipe components
[A].
A comprehensive review of solid particle erosion modeling for oil and gas wells and pipelines applications
[J].
Numerical study of solid particle erosion in a cavity with different wall heights
[J].
Overview on mesh generation methods in CFD of fluid machinery
[J].
流体机械CFD中的网格生成方法进展
[J].
Study on the design and analysis methods of orthogonal experiment
[J].
正交试验设计和分析方法研究
[J].
Corrosion of B10 Cu-Ni alloy in seawater polluted by high concentration of NH4+
[J].
B10铜镍合金在高浓度NH4+污染海水中腐蚀研究
[J].
Microbiologically influenced corrosion mechanism and protection of offshore pipelines
[J].
临海管道微生物腐蚀损伤机制与防护
[J].
Pitting corrosion behavior of X100 pipeline steel in a simulated acidic soil solution under fluctuated cathodic protection potentials based on orthogonal method
[J].
基于正交方法研究阴极保护电位波动下X100管线钢的点蚀行为
[J].
Effect of sand size and temperature on synergistic effect of erosion-corrosion for 20 steel in simulated oilfield produced fluid with sand
[J].
粒径和温度对20号钢冲刷腐蚀协同作用的影响
[J].
Experiment and numerical simulation of sand particle erosion under slug flow condition in a horizontal pipe bend
[J].
Effect of flow velocity on erosion-corrosion of 90-degree horizontal elbow
[J].
